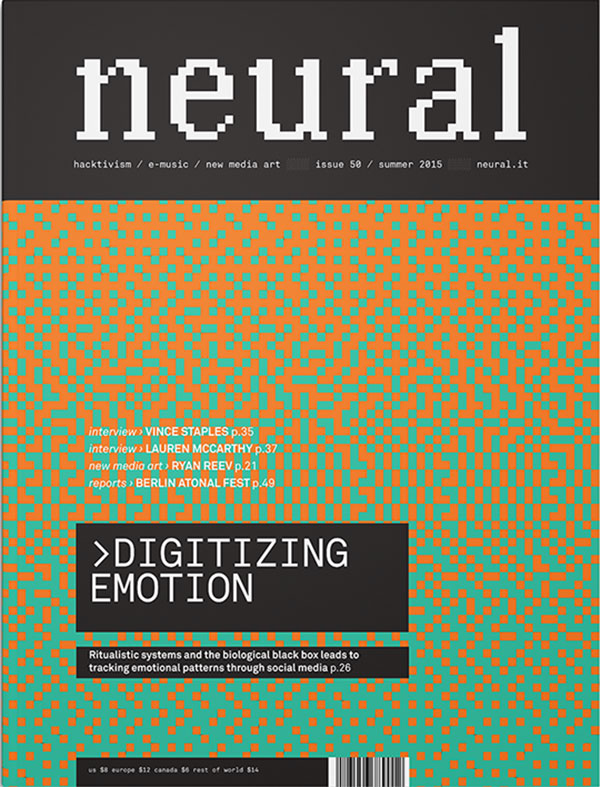
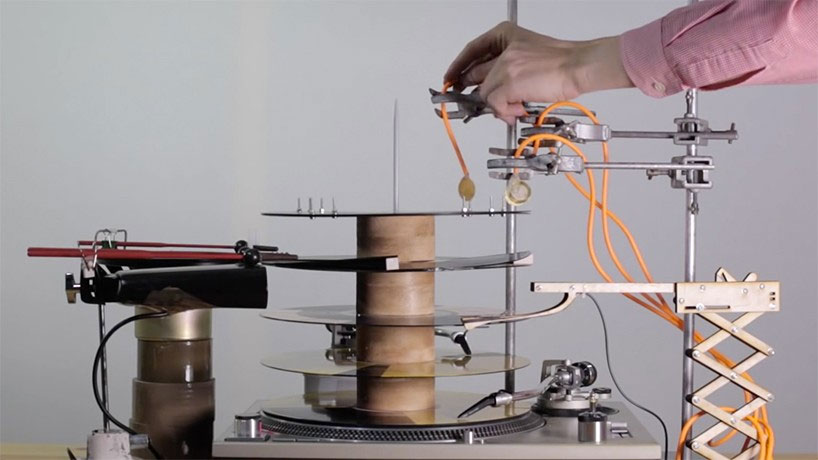
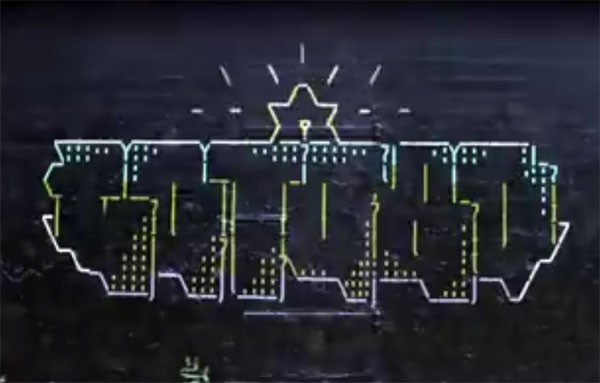
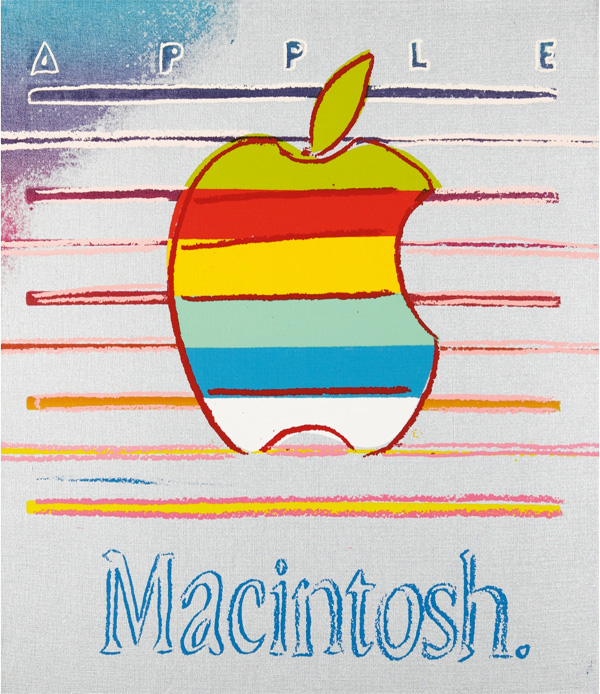
Sometimes the online world reveals unsuspected parallel dimensions. This is an unknown restyle of Neural independently (and secretly as we never knew about it) made by NY-based Motion and Graphic Designer, Clarke Blackham. Very nicely made, perhaps only a bit glossier for the magazine’s line, it testifies once more how even your most familiar outcomes can have another life somewhere else.
- 3D
- 3D printing
- 8 bit
- 8-bit aesthetics
- abstract
- abstraction
- acousmatic
- acoustic
- acoustic space
- acoustic/digital
- activism
- acusmatica
- aesthetics
- algorithm
- algorithms
- ambient
- analogue
- analogue sounds
- analogue to digital
- anonymity
- aound
- archeology
- architecture
- archive
- art
- art hack
- art rock
- artificial intelligence
- artificial life
- audio art
- audio recording and reproduction
- audio surround
- audio-video
- audio-visuals
- auditory culture
- bastard pop
- bend toys
- big data
- bio-art
- bioart
- biological
- bioluminescence
- biopolitics
- biotech
- black culture
- blockchain
- Blu-Ray/DVD + book
- bodies
- book
- book + other media
- booklet
- books
- bookshop
- breakcore
- broadcast
- brutalism
- capitalism
- Carsten Nicolai
- cd + dvd
- cd or other portable media
- cd+dvd video
- China
- cinema
- cinematic arts
- circuit bending
- classical/contemporary
- climate change
- cloud
- clubbing scenes
- code
- communication
- communication strategies
- computation
- Computational Arts
- computer art
- computer games
- computer music
- computer science
- computer voice
- computer-generated comics
- computing
- contemporary art
- copyright
- cosmotechnics
- counterculture
- criticism
- culture jamming
- cyberculture
- cyberfeminism
- cybernetic music
- dark ambient
- data
- data dating
- deepfake
- Deleuze
- demoscene
- design
- digital
- digital art
- digital culture
- digital economy
- digital sculpture
- digitalisation
- DIY
- djing
- drone
- dub
- dvd &/or dvd video
- dvd video
- dystopian
- ecology
- economy
- electro
- electroacoustic music
- electronic art
- electronic dance
- electronic literature
- electronic music
- electronica
- electronics
- electropop
- elettroacustica
- emusic
- ethnic
- exhibition
- experimental
- experimental music
- extra
- fake
- feminism
- festival
- fetishization of the offline
- field recording
- field recordings
- floppy disk
- Fluxus
- folktronica
- free form
- free pdf
- future
- Futurism
- game
- game engine
- gamelan music
- games
- geek culture
- generative
- glitch
- glitch'n'cuts
- global communication
- graphic design
- hacking
- hacktivism
- home devices
- identity
- idm
- images
- impro
- industrial
- information technology
- infrastructure
- installation
- installations
- interactive
- interactive sounds
- interfaces
- internet
- internet art
- internet-based art
- invisible networks
- kinetic
- language
- laptop
- late-capitalism
- light
- literature
- live performances
- machine learning
- machines
- magazine
- maker
- mashup
- media
- media archaeology
- media archeology
- memory
- microsound
- minimal
- mixed-media
- mobile
- modern classical
- multiculturalism
- music
- musica concreta
- musica informatica
- Musique Concrète
- neo-materalism
- net
- net art
- network
- neural
- neural network
- neural networks
- neuroscience
- new classic
- new classical
- new issue
- new media
- new media archeology
- new media art
- NFT
- NFTs
- noise
- noisy
- non-music
- obsolescence
- obsolete techniques
- out-of-body experience
- performance
- performing art
- photography
- plagiarism
- playlist
- plunderphonics
- politics
- porno
- post digital
- post human
- post rock
- post-digital economy
- post–techno
- preservation
- print-only publication
- privacy
- programmazione algoritmica
- psichedelia
- psicoacustica
- psychoacoustics
- psychogeography
- public infrastructure
- public space
- publishing
- pulsar synthesis
- radio
- radio and communication
- radio waves
- radio-art
- remote execution
- Reports
- retro aesthetic
- reverse engineering
- robot
- sci
- science
- science fiction
- security
- simulation
- site-specific
- social history
- social media
- social mythologies
- social network
- society
- software
- sonification
- sound
- sound and vision
- sound art
- sound poetry
- sound sculpture
- sound sculptures
- sounds
- soundscape
- soundscapes
- space
- spoken word
- stereoscopic vision
- street art
- subcultures
- surveillance
- synth music
- synth-disco
- techno
- techno-pop
- techno-social imaginaries
- technology
- technoscience
- telepresence
- text-sound composition
- theatre
- theory
- tokens
- Transmediale
- turntablism
- tv
- USB drive
- utopia
- vide
- video
- video art
- video games
- videogame
- virtual reality
- visual
- visual media
- visual poetry
- vjing
- voice
- wearable
- web
- webapp
- WiFi
- working online
- zine
Projects
- Sonic Genoma
- Suoni Futuri Digitali
- Wicked Style
- nordiC (Dissonanze)
- Tecnologie di Liberazione (2001)
- Virtual Light (1995)
- Internet Underground Guide (1995)
Colophon
- Chief Editor
- Alessandro Ludovico
- Assistant editor
- Aurelio Cianciotta Mendizza
- Contributors
- Josephine Bosma Chiara Ciociola Daphne Dragona Matteo Marangoni Rachel O'Dwyer Paolo Pedercini Paul Prudence Benedetta Sabatini
- Special Projects
- Ivan Iusco
- Chiara Ciociola
- Title Poet
- Nat Muller
- English Copyediting
- Rachel O'Dwyer
- Translations
- Giuseppe Santoiemma
- Advertising & PR Manager
- Benedetta Sabatini
- Production Manager and Digital Archivist
- Cristina Piga
- Technical consulting
- Paolo Mangraviti
Friends

